Former member of Congress · last served 111th Congress
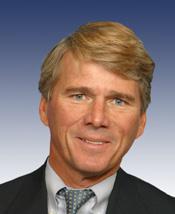
Gene Taylor
Gene Taylor was a Democratic U.S. representative from Mississippi, first elected to Congress in 1989, who sponsored 7 bills that became law (101st–111th Congress).
How we count: “Broke with party” is a yes/no roll call where the member voted against most of their own party on that vote (party as recorded; even splits not counted). “Pork: own share” splits each earmark shared by several members evenly among them.
Recent votes
No recorded roll-call votes in PORKER’s records. Roll-call records start in 2011.
5 most recent bills
- H.R. 6494 To amend the National Defense Authorization Act for Fiscal Year 2010 to improve the Littoral Combat Ship program of the Navy.Dec 22, 2010 · Read twice and referred to the Committee on Armed Services.
- H.R. 6187 To direct the Secretary of the Army to seek to enter into certain contracts regarding roller systems.Oct 1, 2010 · Referred to the Subcommittee on Air and Land Forces.
- H.R. 6157 To direct the Secretary of the Army to seek to enter into certain contracts regarding the self-protective adaptive roller kit II system.Oct 1, 2010 · Referred to the Subcommittee on Air and Land Forces.
- H.R. 6102 To amend the National Defense Authorization Act for Fiscal Year 2010 to extend the authority of the Secretary of the Navy to enter into multiyear contracts…Oct 1, 2010 · Referred to the Subcommittee on Seapower and Expeditionary Forces.
- H.R. 1264 Multiple Peril Insurance Act of 2009Jul 22, 2010 · Rule H. Res. 1549 passed House.
Top bills sponsored
- H.R. 4539 (102nd) To designate the general mail facility of the United States Postal Service in Gulfport, Mississippi, as the "Larkin I. Smith General Mail Facility" and the…Became law
- H.R. 2460 (106th) To designate the United States Post Office located at 125 Border Avenue West in Wiggins, Mississippi, as the "Jay Hanna 'Dizzy' Dean Post Office".Became law
- H.R. 1284 (111th) To designate the facility of the United States Postal Service located at 103 West Main Street in McLain, Mississippi, as the "Major Ed W. Freeman Post Office".Became law
- H.R. 2438 (108th) To designate the facility of the United States Postal Service located at 115 West Pine Street in Hattiesburg, Mississippi, as the "Major Henry A. Commiskey…Became law
- H.R. 3839 (103rd) To designate the United States Post Office located at 220 South 40th Avenue in Hattiesburg, Mississippi, as the "Roy M. Wheat Post Office".Became law
- H.R. 3984 (103rd) To designate the United States post office located at 212 Coleman Avenue in Waveland, Mississippi, as the "John Longo, Jr. Post Office".Became law
- H.R. 3282 (102nd) United States Flag Cruise Ship Competitiveness Act of 1991Passed a chamber
- H.R. 5257 (102nd) United States-Flag Passenger Vessel Act of 1992Passed a chamber
Laws first, then bills that passed a chamber, were reported from committee, or drew the most cosponsors.
Elections Rep. Taylor has won
Rep. Taylor has won 10 U.S. House elections (1990–2008). Of the contested races, margins ran from 18.2 to 62.7 points.
Full election history for this seat →
Source: MIT Election Data and Science Lab, U.S. House V15 / U.S. Senate V8 (CC0), retrieved 2026-10-18; winners matched to member records by seat and term. Results run through the 2024 elections; nothing from 2026 is shown until it is certified. A margin is a fact about one election, never a score of how well a member represents anyone, and PORKER does not rank members by it.
How has Mississippi’s 4th district done while Rep. Taylor served?
2005 to 2010 in MS-4: typical household income was about the same after inflation, the share of people below the poverty line was about the same, and the share of workers looking for a job was up 2.6 points.
Each mini chart has its own scale, fitted to its lines (it does not start at zero), so compare the numbers, not the heights. Teal = district, oxblood = state, grey = U.S.
While they served, not because of them. This shows what happened in Mississippi’s 4th district during Taylor’s time representing it (2003 to 2011). It does not say what the member did or caused. It is not a score, and PORKER never ranks members on it.
One set of district lines. MS-4 was redrawn in 2012 and again in 2022 (the survey year the new lines first appear), but every survey year in Taylor’s term so far (2005 to 2010) uses the same lines, so they can be compared. The Census Bureau has no 2020 yearly estimate.
Official records on bills this member sponsored
111th Congress. What Congress.gov lists for the 8 bills sponsored.
| Record | Bills | Source |
|---|---|---|
| Bills sponsored | 8 | Source: Congress.gov member record, PORKER copy of October 26, 2026 ↗ See them → |
| With a sponsor’s constitutional-authority statement | 0 | None listed |
| With a CBO cost estimate listed | 1 | See the 1 → |
| With a committee report listed | 1 | See the 1 → |
Evidence
- How counted
- Bills where this member is the lead (first-listed) sponsor in the 111th Congress, read from the stored Congress.gov bill records
- Fields
- cboCostEstimates, committeeReports, constitutionalAuthorityStatementText, notes
- PORKER copy refreshed
- October 26, 2026 (nightly)
Read this first. These are counts of records Congress.gov lists. Many bills never get a CBO estimate or a report, so a zero is not a mark against a member. We never show this as a score.
Data as of Oct 26, 2026 · Sources: Congress.gov, Senate.gov, House Clerk, Appropriations Committee earmark tables. PORKER is non-partisan.