Former member of Congress · last served 109th Congress
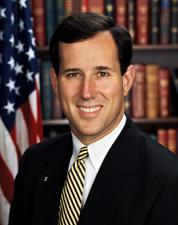
Rick Santorum
Rick Santorum was a Republican U.S. senator from Pennsylvania, first elected to Congress in 1991, who sponsored 7 bills that became law (102nd–109th Congress).
How we count: “Broke with party” is a yes/no roll call where the member voted against most of their own party on that vote (party as recorded; even splits not counted). “Pork: own share” splits each earmark shared by several members evenly among them.
Recent votes
No recorded roll-call votes in PORKER’s records. Roll-call records start in 2011.
5 most recent bills
- S. 843 Combating Autism Act of 2006Dec 19, 2006 · Became Public Law No: 109-416.
- S.Res. 549 A resolution expressing the sense of the Senate regarding modern-day slavery.Dec 9, 2006 · Resolution agreed to in Senate without amendment and with a preamble by Unanimous Consent.
- S.Res. 613 A resolution honoring the life and work of William Wilberforce and commemorating the 200th anniversary of the abolition of the slave trade in Great Britain.Dec 6, 2006 · Resolution agreed to in Senate without amendment and with a preamble by Unanimous Consent. (text: CR 12/7/2006 S11385)
- S. 3997 Landfill Gas Act of 2006Sep 29, 2006 · Read twice and referred to the Committee on Finance.
- S.Res. 592 A resolution designating the week of November 5 through 11, 2006, as "Long-Term Care Awareness Week".Sep 29, 2006 · Referred to the Committee on the Judiciary. (text of measure as introduced: CR S10749)
Top bills sponsored
- S. 1310 (109th) Delaware Water Gap National Recreation Area Improvement ActBecame law
- S. 2017 (108th) A bill to designate the United States courthouse and post office building located at 93 Atocha Street in Ponce, Puerto Rico, as the "Luis A. Ferre United…Became law
- S. 1324 (106th) A bill to expand the boundaries of the Gettysburg National Military Park to include Wills House, and for other purposes.Became law
- S. 3 (108th) Partial-Birth Abortion Ban Act of 2003Became law
- S. 3504 (109th) Fetus Farming Prohibition Act of 2006Became law
- S. 3194 (106th) A bill to designate the facility of the United States Postal Service located at 431 George Street in Millersville, Pennsylvania, as the "Robert S. Walker Post…Became law
- S. 2321 (109th) Louis Braille Bicentennial--Braille Literacy Commemorative Coin ActPassed a chamber
- S. 905 (106th) An act to establish the Lackawanna Valley National Heritage Area and for other purposes.Passed a chamber
Laws first, then bills that passed a chamber, were reported from committee, or drew the most cosponsors.
Elections Sen. Santorum has won
Sen. Santorum has won 2 U.S. House elections (1990–1992) and 2 U.S. Senate elections (1994, 2000). Of the contested races, margins ran from 2.5 to 22.6 points.
Full election history for this seat →
Source: MIT Election Data and Science Lab, U.S. House V15 / U.S. Senate V8 (CC0), retrieved 2026-10-18; winners matched to member records by seat and term. Results run through the 2024 elections; nothing from 2026 is shown until it is certified. A margin is a fact about one election, never a score of how well a member represents anyone, and PORKER does not rank members by it.
How has Pennsylvania done while Sen. Santorum served?
2005 to 2006 in Pennsylvania: typical household income was about the same after inflation, the share of people below the poverty line was about the same, and the share of workers looking for a job was down 0.5 points.
Each mini chart has its own scale, fitted to its lines (it does not start at zero), so compare the numbers, not the heights. Oxblood = state, grey = U.S.
While they served, not because of them. This shows what happened in Pennsylvania during Santorum’s time representing it (1995 to 2007). It does not say what the member did or caused. It is not a score, and PORKER never ranks members on it.
Survey years start at 2005. The yearly estimates for Pennsylvania begin in 2005, so 1995 to 2004 are not shown. No 2020 yearly estimate exists.
Official records on bills this member sponsored
109th Congress. What Congress.gov lists for the 156 bills sponsored.
| Record | Bills | Source |
|---|---|---|
| Bills sponsored | 156 | Source: Congress.gov member record, PORKER copy of October 26, 2026 ↗ See them → |
| With a CBO cost estimate listed | 4 | See the 4 → |
| With a committee report listed | 4 | See the 4 → |
| With a Congress.gov note | 4 | See the 4 → |
Evidence
- How counted
- Bills where this member is the lead (first-listed) sponsor in the 109th Congress, read from the stored Congress.gov bill records
- Fields
- cboCostEstimates, committeeReports, constitutionalAuthorityStatementText, notes
- PORKER copy refreshed
- October 26, 2026 (nightly)
Read this first. These are counts of records Congress.gov lists. Many bills never get a CBO estimate or a report, so a zero is not a mark against a member. We never show this as a score.
Data as of Oct 26, 2026 · Sources: Congress.gov, Senate.gov, House Clerk, Appropriations Committee earmark tables. PORKER is non-partisan.