Former member of Congress · last served 115th Congress
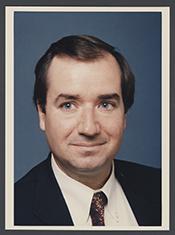
Edward R. Royce
Ed Royce was a Republican U.S. representative from California, first elected to Congress in 1993, who voted with most Republicans on 92% of the 112th Congress’s yes/no votes and sponsored 11 bills that became law (113th–115th Congress).
How we count: “Broke with party” is a yes/no roll call where the member voted against most of their own party on that vote (party as recorded; even splits not counted). “Pork: own share” splits each earmark shared by several members evenly among them.
5 most recent votes
- YeaOn Motion to Concur in the Senate Amendments — American Taxpayer Relief Act of 2012Jan 1, 2013 · Passed
- YeaOn Agreeing to the Resolution — Providing for consideration of the Senate amendments to the bill (H.R. 8) to extend certain tax relief provisions enacted in 2001 and…Jan 1, 2013 · Passed
- YeaOn Motion to Suspend the Rules and Concur in the Senate Amendment — Drywall Safety Act of 2012Jan 1, 2013 · Passed
- YeaOn Motion to Suspend the Rules and Concur in the Senate Amendment — To provide for the conveyance of certain property from the United States to the Maniilaq Association located in Kotzebue, Alaska.Jan 1, 2013 · Passed
- YeaOn Motion to Suspend the Rules and Pass — Congressional Pay Freeze and Fiscal Responsibility ActJan 1, 2013 · Passed
5 most recent bills
- H.R. 7382 Fannie Mae and Freddie Mac Lobbying Regulation Act of 2018Dec 20, 2018 · Referred to the House Committee on Financial Services.
- H.Res. 1149 Recognizing that the United States-Republic of Korea alliance serves as a linchpin of regional stability and bilateral security, and exemplifies the broad and…Dec 11, 2018 · Motion to reconsider laid on the table Agreed to without objection.
- H.R. 600 Digital GAP ActOct 5, 2018 · Placed on Senate Legislative Calendar under General Orders. Calendar No. 624.
- H.R. 5381 GRATER Act of 2018Sep 27, 2018 · Ordered to be Reported (Amended) by Voice Vote.
- H.R. 5480 Women's Entrepreneurship and Economic Empowerment Act of 2018Jul 18, 2018 · Received in the Senate and Read twice and referred to the Committee on Foreign Relations.
Top bills sponsored
- H.R. 2494 (114th) Eliminate, Neutralize, and Disrupt Wildlife Trafficking Act of 2016Became law
- H.R. 2998 (107th) Radio Free Afghanistan ActBecame law
- H.R. 1625 (115th) Consolidated Appropriations Act, 2018Became law
- H.R. 757 (114th) North Korea Sanctions and Policy Enhancement Act of 2016Became law
- H.R. 3445 (115th) AGOA and MCA Modernization ActBecame law
- H.R. 3468 (113th) Credit Union Share Insurance Fund Parity ActBecame law
- H.R. 1151 (113th) To direct the Secretary of State to develop a strategy to obtain observer status for Taiwan at the triennial International Civil Aviation Organization…Became law
- H.R. 1464 (112th) North Korean Child Welfare Act of 2012Became law
Laws first, then bills that passed a chamber, were reported from committee, or drew the most cosponsors.
Elections Rep. Royce has won
Rep. Royce has won 13 U.S. House elections (1992–2016). Of the contested races, margins ran from 14.5 to 38.2 points.
Full election history for this seat →
Source: MIT Election Data and Science Lab, U.S. House V15 / U.S. Senate V8 (CC0), retrieved 2026-10-18; winners matched to member records by seat and term. Results run through the 2024 elections; nothing from 2026 is shown until it is certified. A margin is a fact about one election, never a score of how well a member represents anyone, and PORKER does not rank members by it.
How has California’s 39th district done while Rep. Royce served?
2013 to 2018 in CA-39: typical household income was about the same after inflation, the share of people below the poverty line was down 2.6 points, and the share of workers looking for a job was down 3.1 points.
Each mini chart has its own scale, fitted to its lines (it does not start at zero), so compare the numbers, not the heights. Teal = district, oxblood = state, grey = U.S.
While they served, not because of them. This shows what happened in California’s 39th district during Royce’s time representing it (2013 to 2019). It does not say what the member did or caused. It is not a score, and PORKER never ranks members on it.
One set of district lines. CA-39 was redrawn in 2012 and again in 2022 (the survey year the new lines first appear), but every survey year in Royce’s term so far (2013 to 2018) uses the same lines, so they can be compared. The Census Bureau has no 2020 yearly estimate.
Official records on bills this member sponsored
115th Congress. What Congress.gov lists for the 34 bills sponsored.
| Record | Bills | Source |
|---|---|---|
| Bills sponsored | 34 | Source: Congress.gov member record, PORKER copy of October 26, 2026 ↗ See them → |
| With a sponsor’s constitutional-authority statement | 29 | See the 29 → |
| With a CBO cost estimate listed | 14 | See the 14 → |
| With a committee report listed | 8 | See the 8 → |
Evidence
- How counted
- Bills where this member is the lead (first-listed) sponsor in the 115th Congress, read from the stored Congress.gov bill records
- Fields
- cboCostEstimates, committeeReports, constitutionalAuthorityStatementText, notes
- PORKER copy refreshed
- October 26, 2026 (nightly)
Read this first. These are counts of records Congress.gov lists. Many bills never get a CBO estimate or a report, so a zero is not a mark against a member. We never show this as a score.
Data as of Oct 26, 2026 · latest recorded House vote Sep 16, 2026 · Sources: Congress.gov, Senate.gov, House Clerk, Appropriations Committee earmark tables. PORKER is non-partisan.