Former member of Congress · last served 116th Congress
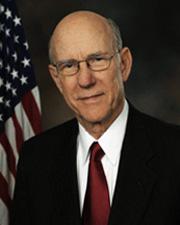
Pat Roberts
Pat Roberts was a Republican U.S. senator from Kansas, first elected to Congress in 1981, who voted with most Republicans on 89% of the 112th Congress’s yes/no votes and sponsored 6 bills that became law (113th–116th Congress).
How we count: “Broke with party” is a yes/no roll call where the member voted against most of their own party on that vote (party as recorded; even splits not counted). “Pork: own share” splits each earmark shared by several members evenly among them.
5 most recent votes
- YeaOn Passage of the Bill — American Taxpayer Relief Act of 2012Jan 1, 2013 · Bill Passed
- NayOn the Nomination — Nomination voteDec 30, 2012 · Nomination Confirmed
- NayOn the Nomination — Nomination voteDec 30, 2012 · Nomination Confirmed
- NayOn Passage of the Bill — Disaster Relief Appropriations Act, 2013Dec 28, 2012 · Bill Passed
- YeaOn the Amendment — Disaster Relief Appropriations Act, 2013Dec 28, 2012 · Amendment Rejected
5 most recent bills
- S. 4054 United States Grain Standards Reauthorization Act of 2020Dec 16, 2020 · By Senator Roberts from Committee on Agriculture, Nutrition, and Forestry filed written report. Report No. 116-334.
- S. 1636 Ensuring Innovation ActDec 15, 2020 · Held at the desk.
- S. 4845 Agricultural Emissions Data Act of 2020Oct 22, 2020 · Read twice and referred to the Committee on Agriculture, Nutrition, and Forestry.
- S. 4840 Ensuring Parity in MA for Audio-Only Telehealth Act of 2020Oct 21, 2020 · Read twice and referred to the Committee on Finance.
- S.Res. 564 A resolution commemorating May 8, 2020, the 75th anniversary of Victory in Europe Day, the day on which the Allies achieved victory in Europe during World War…May 7, 2020 · Referred to the Committee on Foreign Relations. (text: CR S2326)
Top bills sponsored
- H.R. 3048 (101st) To designate the Agricultural Research Service, U.S. Department of Agriculture, animal health research building in Clay Center, Nebraska, as the "Virginia D.…Became law
- S. 2278 (115th) State Offices of Rural Health Reauthorization Act of 2018Became law
- H.R. 2854 (104th) Federal Agriculture Improvement and Reform Act of 1996Became law
- S. 1000 (105th) A bill to designate the United States courthouse at 500 State Avenue in Kansas City, Kansas, as the "Robert J. Dole United States Courthouse".Became law
- S. 2040 (115th) A bill to designate the facility of the United States Postal Service located at 621 Kansas Avenue in Atchison, Kansas, as the "Amelia Earhart Post Office…Became law
- S. 1718 (108th) A bill to designate the facility of the United States Postal Service located at 3710 West 73rd Terrace in Prairie Village, Kansas, as the "Senator James B.…Became law
- S. 1025 (109th) Wichita Project Equus Beds Division Authorization Act of 2005Became law
- S. 2136 (108th) An original bill to extend the final report date and termination date of the National Commission on Terrorist Attacks Upon the United States, to provide…Became law
Laws first, then bills that passed a chamber, were reported from committee, or drew the most cosponsors.
Elections Sen. Roberts has won
Sen. Roberts has won 8 U.S. House elections (1980–1994) and 4 U.S. Senate elections (1996, 2002, 2008, 2014). Of the contested races, margins ran from 10.6 to 73.4 points.
Full election history for this seat →
Source: MIT Election Data and Science Lab, U.S. House V15 / U.S. Senate V8 (CC0), retrieved 2026-10-18; winners matched to member records by seat and term. Results run through the 2024 elections; nothing from 2026 is shown until it is certified. A margin is a fact about one election, never a score of how well a member represents anyone, and PORKER does not rank members by it.
How has Kansas done while Sen. Roberts served?
2005 to 2019 in Kansas: typical household income was up 10% after inflation, the share of people below the poverty line was about the same, and the share of workers looking for a job was down 1.8 points.
Each mini chart has its own scale, fitted to its lines (it does not start at zero), so compare the numbers, not the heights. Oxblood = state, grey = U.S.
While they served, not because of them. This shows what happened in Kansas during Roberts’s time representing it (1997 to 2021). It does not say what the member did or caused. It is not a score, and PORKER never ranks members on it.
Survey years start at 2005. The yearly estimates for Kansas begin in 2005, so 1997 to 2004 are not shown. No 2020 yearly estimate exists.
Official records on bills this member sponsored
116th Congress. What Congress.gov lists for the 22 bills sponsored.
| Record | Bills | Source |
|---|---|---|
| Bills sponsored | 22 | Source: Congress.gov member record, PORKER copy of October 26, 2026 ↗ See them → |
| With a CBO cost estimate listed | 2 | See the 2 → |
| With a committee report listed | 1 | See the 1 → |
Evidence
- How counted
- Bills where this member is the lead (first-listed) sponsor in the 116th Congress, read from the stored Congress.gov bill records
- Fields
- cboCostEstimates, committeeReports, constitutionalAuthorityStatementText, notes
- PORKER copy refreshed
- October 26, 2026 (nightly)
Read this first. These are counts of records Congress.gov lists. Many bills never get a CBO estimate or a report, so a zero is not a mark against a member. We never show this as a score.
Data as of Oct 26, 2026 · latest recorded Senate vote Sep 30, 2026 · Sources: Congress.gov, Senate.gov, House Clerk, Appropriations Committee earmark tables. PORKER is non-partisan.