Former member of Congress · last served 113th Congress
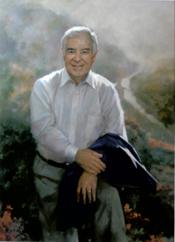
Nick J. Rahall II
Nick Rahall was a Democratic U.S. representative from West Virginia, first elected to Congress in 1977, who voted with most Democrats on 83% of the 112th Congress’s yes/no votes.
How we count: “Broke with party” is a yes/no roll call where the member voted against most of their own party on that vote (party as recorded; even splits not counted). “Pork: own share” splits each earmark shared by several members evenly among them.
5 most recent votes
- YeaOn Motion to Concur in the Senate Amendments — American Taxpayer Relief Act of 2012Jan 1, 2013 · Passed
- YeaOn Agreeing to the Resolution — Providing for consideration of the Senate amendments to the bill (H.R. 8) to extend certain tax relief provisions enacted in 2001 and…Jan 1, 2013 · Passed
- YeaOn Motion to Suspend the Rules and Concur in the Senate Amendment — Drywall Safety Act of 2012Jan 1, 2013 · Passed
- YeaOn Motion to Suspend the Rules and Concur in the Senate Amendment — To provide for the conveyance of certain property from the United States to the Maniilaq Association located in Kotzebue, Alaska.Jan 1, 2013 · Passed
- YeaOn Motion to Suspend the Rules and Pass — Congressional Pay Freeze and Fiscal Responsibility ActJan 1, 2013 · Passed
5 most recent bills
- H.R. 3380 To delay any increases in premium rates for flood insurance coverage under the National Flood Insurance Program until the Federal Emergency Management Agency…Oct 30, 2013 · Referred to the House Committee on Financial Services.
- H.Con.Res. 57 Expressing the opposition of the Congress to the Environmental Protection Agency's proposed rule establishing new source performance standards to limit…Sep 27, 2013 · Referred to the Subcommittee on Energy and Power.
- H.R. 2841 Guard and Reserve Equal Access to Health ActJul 25, 2013 · Referred to the House Committee on Armed Services.
- H.R. 2428 SAFE Bridges Act of 2013Jun 20, 2013 · Referred to the Subcommittee on Highways and Transit.
- H.J.Res. 42 Proposing an amendment to the Constitution of the United States to clarify that the Constitution neither prohibits voluntary prayer nor requires prayer in…Apr 30, 2013 · Referred to the Subcommittee on the Constitution and Civil Justice.
Top bills sponsored
- H.R. 2763 (102nd) National Geologic Mapping Act of 1992Became law
- H.R. 3977 (100th) Mining and Mineral Resources Research Institute Amendments of 1988Became law
- H.R. 900 (100th) West Virginia National Interest River Conservation Act of 1987Became law
- H.R. 2178 (103rd) Hazardous Materials Transportation Act Amendments of 1993Became law
- H.R. 5579 (101st) To amend section 28(w) of the Mineral Leasing Act, and for other purposes.Became law
- H.R. 3689 (111th) To provide for an extension of the legislative authority of the Vietnam Veterans Memorial Fund, Inc. to establish a Vietnam Veterans Memorial visitor center…Became law
- H.R. 3858 (107th) New River Gorge Boundary Act of 2002Became law
- H.R. 3646 (106th) For the relief of certain Persian Gulf evacuees.Became law
Laws first, then bills that passed a chamber, were reported from committee, or drew the most cosponsors.
Elections Rep. Rahall has won
Rep. Rahall has won 19 U.S. House elections (1976–2012). Of the contested races, margins ran from 3.9 to 82.6 points.
Full election history for this seat →
Source: MIT Election Data and Science Lab, U.S. House V15 / U.S. Senate V8 (CC0), retrieved 2026-10-18; winners matched to member records by seat and term. Results run through the 2024 elections; nothing from 2026 is shown until it is certified. A margin is a fact about one election, never a score of how well a member represents anyone, and PORKER does not rank members by it.
How has West Virginia done while Rep. Rahall served?
2005 to 2014 in West Virginia: typical household income was about the same after inflation, the share of people below the poverty line was about the same, and the share of workers looking for a job was about the same.
Each mini chart has its own scale, fitted to its lines (it does not start at zero), so compare the numbers, not the heights. Oxblood = state, grey = U.S.
While they served, not because of them. This shows what happened in West Virginia during Rahall’s time representing it (1993 to 2015). It does not say what the member did or caused. It is not a score, and PORKER never ranks members on it.
Survey years start at 2005. The yearly estimates for West Virginia begin in 2005, so 1993 to 2004 are not shown. No 2020 yearly estimate exists.
Official records on bills this member sponsored
113th Congress. What Congress.gov lists for the 10 bills sponsored.
| Record | Bills | Source |
|---|---|---|
| Bills sponsored | 10 | Source: Congress.gov member record, PORKER copy of October 26, 2026 ↗ See them → |
| With a sponsor’s constitutional-authority statement | 9 | See the 9 → |
| With a CBO cost estimate listed | 0 | None listed |
| With a committee report listed | 0 | None listed |
Evidence
- How counted
- Bills where this member is the lead (first-listed) sponsor in the 113th Congress, read from the stored Congress.gov bill records
- Fields
- cboCostEstimates, committeeReports, constitutionalAuthorityStatementText, notes
- PORKER copy refreshed
- October 26, 2026 (nightly)
Read this first. These are counts of records Congress.gov lists. Many bills never get a CBO estimate or a report, so a zero is not a mark against a member. We never show this as a score.
Data as of Oct 26, 2026 · latest recorded House vote Sep 16, 2026 · Sources: Congress.gov, Senate.gov, House Clerk, Appropriations Committee earmark tables. PORKER is non-partisan.