Former member of Congress · last served 115th Congress
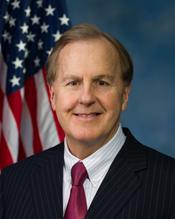
Robert Pittenger
Robert Pittenger was a Republican U.S. representative from North Carolina, first elected to Congress in 2013, who sponsored 1 bill that became law (113th–115th Congress).
How we count: “Broke with party” is a yes/no roll call where the member voted against most of their own party on that vote (party as recorded; even splits not counted). “Pork: own share” splits each earmark shared by several members evenly among them.
Recent votes
No recorded roll-call votes in PORKER’s records. Roll-call records start in 2011.
5 most recent bills
- H.R. 5841 Foreign Investment Risk Review Modernization Act of 2018Jun 27, 2018 · Received in the Senate. Read twice. Placed on Senate Legislative Calendar under General Orders. Calendar No. 492.
- H.R. 5663 Make Sanctuary Cities Pay for the Wall Act of 2018May 22, 2018 · Referred to the Subcommittee on Immigration and Border Security.
- H.R. 4311 Foreign Investment Risk Review Modernization Act of 2017Apr 12, 2018 · Hearings Held by the Subcommittee on Monetary Policy and Trade Prior to Referral.
- H.R. 4757 Fully Informed District Bank ActJan 10, 2018 · Referred to the House Committee on Financial Services.
- H.Con.Res. 94 Recognizing the opening of the nonsectarian Museum of the Bible in Washington, D.C., the only museum of its size and scope in the world devoted exclusively to…Nov 28, 2017 · Referred to the Subcommittee on Federal Lands.
Top bills sponsored
- H.R. 3627 (113th) Kilah Davenport Child Protection Act of 2013Became law
- H.R. 3240 (113th) Regulation D Study ActPassed a chamber
- H.R. 1195 (114th) Bureau of Consumer Financial Protection Advisory Boards ActPassed a chamber
- H.R. 2148 (115th) Clarifying Commercial Real Estate LoansPassed a chamber
- H.R. 5607 (114th) Enhancing Treasury's Anti-Terror Tools ActPassed a chamber
- H.R. 4383 (113th) Bureau of Consumer Financial Protection Small Business Advisory Board ActReported from committee
- H.R. 5729 (114th) Stop U.S. Support for State Sponsors of Terrorism ActReported from committee
- H.R. 4131 (115th) No Abortion Bonds Act104 cosponsors
Laws first, then bills that passed a chamber, were reported from committee, or drew the most cosponsors.
Elections Rep. Pittenger has won
Rep. Pittenger has won 3 U.S. House elections (2012–2016). Of the contested races, margins ran from 6.1 to 16.4 points.
Full election history for this seat →
Source: MIT Election Data and Science Lab, U.S. House V15 / U.S. Senate V8 (CC0), retrieved 2026-10-18; winners matched to member records by seat and term. Results run through the 2024 elections; nothing from 2026 is shown until it is certified. A margin is a fact about one election, never a score of how well a member represents anyone, and PORKER does not rank members by it.
How has North Carolina’s 9th district done while Rep. Pittenger served?
2016 to 2018 in NC-9: typical household income was about the same after inflation, the share of people below the poverty line was down 3.0 points, and the share of workers looking for a job was down 1.4 points.
Each mini chart has its own scale, fitted to its lines (it does not start at zero), so compare the numbers, not the heights. Teal = district, oxblood = state, grey = U.S.
While they served, not because of them. This shows what happened in North Carolina’s 9th district during Pittenger’s time representing it (2013 to 2019). It does not say what the member did or caused. It is not a score, and PORKER never ranks members on it.
Only one set of district lines is shown. NC-9 was redrawn in 2012, 2016, 2022 and again in 2024, and a redrawn district is a different place. So this card shows only the longest stretch on the same lines during the term, 2016 to 2018 (no 2020 yearly estimate), not the full 2013 to 2019.
Official records on bills this member sponsored
115th Congress. What Congress.gov lists for the 14 bills sponsored.
| Record | Bills | Source |
|---|---|---|
| Bills sponsored | 14 | Source: Congress.gov member record, PORKER copy of October 26, 2026 ↗ See them → |
| With a sponsor’s constitutional-authority statement | 12 | See the 12 → |
| With a CBO cost estimate listed | 2 | See the 2 → |
| With a committee report listed | 2 | See the 2 → |
Evidence
- How counted
- Bills where this member is the lead (first-listed) sponsor in the 115th Congress, read from the stored Congress.gov bill records
- Fields
- cboCostEstimates, committeeReports, constitutionalAuthorityStatementText, notes
- PORKER copy refreshed
- October 26, 2026 (nightly)
Read this first. These are counts of records Congress.gov lists. Many bills never get a CBO estimate or a report, so a zero is not a mark against a member. We never show this as a score.
Data as of Oct 26, 2026 · Sources: Congress.gov, Senate.gov, House Clerk, Appropriations Committee earmark tables. PORKER is non-partisan.