Former member of Congress · last served 112th Congress
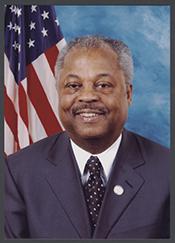
Donald M. Payne
Donald Payne was a Democratic U.S. representative from New Jersey, first elected to Congress in 1989, who voted with most Democrats on 93% of the 112th Congress’s yes/no votes and sponsored 4 bills that became law (101st–112th Congress).
How we count: “Broke with party” is a yes/no roll call where the member voted against most of their own party on that vote (party as recorded; even splits not counted). “Pork: own share” splits each earmark shared by several members evenly among them.
5 most recent votes
- Not VotingOn Ordering the Previous Question — Providing for consideration of the bill (H.R. 2842) to authorize all Bureau of Reclamation conduit facilities for hydropower development…Mar 6, 2012 · Passed
- Not VotingOn Motion to Suspend the Rules and Pass — To apply the countervailing duty provisions of the Tariff Act of 1930 to nonmarket economy countries, and for other purposes.Mar 6, 2012 · Passed
- Not VotingOn Motion to Suspend the Rules and Pass — To designate the facility of the United States Postal Service located at 401 Old Dixie Highway in Jupiter, Florida, as the "Roy Schallern…Mar 5, 2012 · Passed
- Not VotingOn Motion to Suspend the Rules and Agree, as Amended — Condemning the Government of Iran for its continued persecution, imprisonment, and sentencing of Youcef Nadarkhani on the charge of…Mar 1, 2012 · Passed
- Not VotingOn Motion to Suspend the Rules and Pass — St. Croix River Crossing Project Authorization ActMar 1, 2012 · Passed
5 most recent bills
- H.R. 2896 To designate the facility of the United States Postal Service located at 369 Martin Luther King Jr. Drive in Jersey City, New Jersey, as the "Judge Shirley A.…Aug 29, 2012 · Committee on Homeland Security and Governmental Affairs referred to Subcommittee on Federal Financial Management, Government Information, Federal Services…
- H.R. 2181 To authorize National Mall Liberty Fund D.C. to establish a memorial on Federal land in the District of Columbia to honor free persons and slaves who fought…Jul 11, 2012 · CHANGE OF PRIMARY SPONSOR REQUEST - Mr. Butterfield asked unanimous consent that he be considered the primary sponsor of H.R. 2181 in lieu of the late Donald…
- H.R. 4141 International Food Assistance Improvement Act of 2012Jun 7, 2012 · Ordered to be Reported (Amended) by Voice Vote.
- H.R. 4130 Althea Gibson Excellence ActApr 26, 2012 · Referred to the Subcommittee on Domestic Monetary Policy and Technology.
- H.R. 4113 To amend title II of the Elementary and Secondary Education Act of 1965 to help close the gaps in principal preparation and provide new principals with the…Feb 29, 2012 · Referred to the House Committee on Education and the Workforce.
Top bills sponsored
- H.R. 3432 (110th) Commission on the Abolition of the Transatlantic Slave Trade ActBecame law
- H.J.Res. 499 (102nd) Designating July 2, 1992, as "National Literacy Day".Became law
- H.J.Res. 213 (103rd) Designating July 2, 1993 and July 2, 1994 as "National Literacy Day".Became law
- H.J.Res. 259 (102nd) Designating July 2, 1991, as "National Literacy Day".Became law
- H.R. 2003 (110th) Ethiopia Democracy and Accountability Act of 2007Passed a chamber
- H.Con.Res. 211 (110th) Supporting the goals and ideals of World Diabetes Day.Passed a chamber
- H.Con.Res. 75 (106th) Condemning the National Islamic Front (NIF) government for its genocidal war in southern Sudan, support for terrorism, and continued human rights violations…Passed a chamber
- H.Con.Res. 151 (103rd) Concerning the movement toward democracy in the Federal Republic of Nigeria.Passed a chamber
Laws first, then bills that passed a chamber, were reported from committee, or drew the most cosponsors.
Elections Rep. Payne has won
Rep. Payne has won 12 U.S. House elections (1988–2010). Of the contested races, margins ran from 54.0 to 97.8 points.
Full election history for this seat →
Source: MIT Election Data and Science Lab, U.S. House V15 / U.S. Senate V8 (CC0), retrieved 2026-10-18; winners matched to member records by seat and term. Results run through the 2024 elections; nothing from 2026 is shown until it is certified. A margin is a fact about one election, never a score of how well a member represents anyone, and PORKER does not rank members by it.
How has New Jersey’s 10th district done while Rep. Payne served?
2005 to 2011 in NJ-10: typical household income was down 11% after inflation, the share of people below the poverty line was about the same, and the share of workers looking for a job was up 5.4 points.
Each mini chart has its own scale, fitted to its lines (it does not start at zero), so compare the numbers, not the heights. Teal = district, oxblood = state, grey = U.S.
While they served, not because of them. This shows what happened in New Jersey’s 10th district during Payne’s time representing it (1989 to 2012). It does not say what the member did or caused. It is not a score, and PORKER never ranks members on it.
One set of district lines. NJ-10 was redrawn in 2022 (the survey year the new lines first appear), but every survey year in Payne’s term so far (2005 to 2011) uses the same lines, so they can be compared. The Census Bureau has no 2020 yearly estimate.
Official records on bills this member sponsored
112th Congress. What Congress.gov lists for the 18 bills sponsored.
| Record | Bills | Source |
|---|---|---|
| Bills sponsored | 18 | Source: Congress.gov member record, PORKER copy of October 26, 2026 ↗ See them → |
| With a sponsor’s constitutional-authority statement | 11 | See the 11 → |
| With a CBO cost estimate listed | 1 | See the 1 → |
| With a committee report listed | 0 | None listed |
Evidence
- How counted
- Bills where this member is the lead (first-listed) sponsor in the 112th Congress, read from the stored Congress.gov bill records
- Fields
- cboCostEstimates, committeeReports, constitutionalAuthorityStatementText, notes
- PORKER copy refreshed
- October 26, 2026 (nightly)
Read this first. These are counts of records Congress.gov lists. Many bills never get a CBO estimate or a report, so a zero is not a mark against a member. We never show this as a score.
Data as of Oct 26, 2026 · latest recorded House vote Sep 16, 2026 · Sources: Congress.gov, Senate.gov, House Clerk, Appropriations Committee earmark tables. PORKER is non-partisan.