Former member of Congress · last served 115th Congress
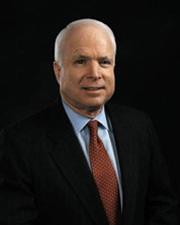
John McCain
John Mccain was a Republican U.S. senator from Arizona, first elected to Congress in 1983, who voted with most Republicans on 85% of the 112th Congress’s yes/no votes and sponsored 3 bills that became law (113th–115th Congress).
How we count: “Broke with party” is a yes/no roll call where the member voted against most of their own party on that vote (party as recorded; even splits not counted). “Pork: own share” splits each earmark shared by several members evenly among them.
5 most recent votes
- YeaOn Passage of the Bill — American Taxpayer Relief Act of 2012Jan 1, 2013 · Bill Passed
- YeaOn the Nomination — Nomination voteDec 30, 2012 · Nomination Confirmed
- NayOn the Nomination — Nomination voteDec 30, 2012 · Nomination Confirmed
- NayOn Passage of the Bill — Disaster Relief Appropriations Act, 2013Dec 28, 2012 · Bill Passed
- YeaOn the Amendment — Disaster Relief Appropriations Act, 2013Dec 28, 2012 · Amendment Rejected
5 most recent bills
- S. 1403 21st Century Conservation Service Corps ActDec 6, 2018 · By Senator Murkowski from Committee on Energy and Natural Resources filed written report. Report No. 115-420.
- S. 146 Border Security Technology Accountability Act of 2017Apr 16, 2018 · Placed on Senate Legislative Calendar under General Orders. Calendar No. 379.
- S. 772 Ashlynne Mike AMBER Alert in Indian Country ActApr 13, 2018 · Became Public Law No: 115-166.
- S. 1519 National Defense Authorization Act for Fiscal Year 2018Mar 22, 2018 · Motion to proceed to consideration of measure made in Senate. (consideration: CR S1886-1892, S1892-1931)
- S. 2060 Burma Human Rights and Freedom Act of 2018Feb 12, 2018 · Placed on Senate Legislative Calendar under General Orders. Calendar No. 307.
Top bills sponsored
- S.J.Res. 35 (100th) A joint resolution relating to the commemoration of January 28, 1988, as a "National Day of Excellence".Became law
- S. 2167 (101st) Native American Languages ActBecame law
- S. 1354 (105th) A bill to amend the Communications Act of 1934 to provide for the designation of common carriers not subject to the jurisdiction of a State commission as…Became law
- S. 579 (108th) National Transportation Safety Board Reauthorization Act of 2003Became law
- S. 1970 (104th) National Museum of the American Indian Act Amendments of 1996Became law
- S. 790 (104th) Federal Reports Elimination and Sunset Act of 1995Became law
- S. 1834 (104th) A bill to reauthorize the Indian Environmental General Assistance Program Act of 1992, and for other purposes.Became law
- S. 654 (103rd) A bill to amend the Indian Environmental General Assistance Program Act of 1992 to extend the authorization of appropriations.Became law
Laws first, then bills that passed a chamber, were reported from committee, or drew the most cosponsors.
Elections Sen. McCain has won
Sen. McCain has won 2 U.S. House elections (1982–1984) and 6 U.S. Senate elections (1986, 1992, 1998, 2004, 2010, 2016). Of the contested races, margins ran from 13.0 to 56.1 points.
Full election history for this seat →
Source: MIT Election Data and Science Lab, U.S. House V15 / U.S. Senate V8 (CC0), retrieved 2026-10-18; winners matched to member records by seat and term. Results run through the 2024 elections; nothing from 2026 is shown until it is certified. A margin is a fact about one election, never a score of how well a member represents anyone, and PORKER does not rank members by it.
How has Arizona done while Sen. McCain served?
2005 to 2017 in Arizona: typical household income was about the same after inflation, the share of people below the poverty line was up 0.7 points, and the share of workers looking for a job was down 0.5 points.
Each mini chart has its own scale, fitted to its lines (it does not start at zero), so compare the numbers, not the heights. Oxblood = state, grey = U.S.
While they served, not because of them. This shows what happened in Arizona during McCain’s time representing it (1987 to 2018). It does not say what the member did or caused. It is not a score, and PORKER never ranks members on it.
Survey years start at 2005. The yearly estimates for Arizona begin in 2005, so 1987 to 2004 are not shown. No 2020 yearly estimate exists.
Official records on bills this member sponsored
115th Congress. What Congress.gov lists for the 24 bills sponsored.
| Record | Bills | Source |
|---|---|---|
| Bills sponsored | 24 | Source: Congress.gov member record, PORKER copy of October 26, 2026 ↗ See them → |
| With a CBO cost estimate listed | 6 | See the 6 → |
| With a committee report listed | 5 | See the 5 → |
Evidence
- How counted
- Bills where this member is the lead (first-listed) sponsor in the 115th Congress, read from the stored Congress.gov bill records
- Fields
- cboCostEstimates, committeeReports, constitutionalAuthorityStatementText, notes
- PORKER copy refreshed
- October 26, 2026 (nightly)
Read this first. These are counts of records Congress.gov lists. Many bills never get a CBO estimate or a report, so a zero is not a mark against a member. We never show this as a score.
Data as of Oct 26, 2026 · latest recorded Senate vote Sep 30, 2026 · Sources: Congress.gov, Senate.gov, House Clerk, Appropriations Committee earmark tables. PORKER is non-partisan.