Former member of Congress · last served 109th Congress
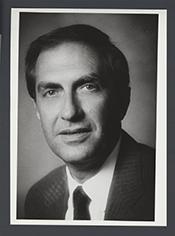
Joel Hefley
Joel Hefley was a Republican U.S. representative from Colorado, first elected to Congress in 1987, who sponsored 6 bills that became law (100th–109th Congress).
How we count: “Broke with party” is a yes/no roll call where the member voted against most of their own party on that vote (party as recorded; even splits not counted). “Pork: own share” splits each earmark shared by several members evenly among them.
Recent votes
No recorded roll-call votes in PORKER’s records. Roll-call records start in 2011.
5 most recent bills
- H.R. 6287 National Heritage Areas Partnership ActSep 29, 2006 · Referred to the House Committee on Resources.
- H.R. 4235 Browns Canyon Wilderness ActJul 27, 2006 · Subcommittee Hearings Held.
- H.R. 5839 Leadership PAC Prohibition Act of 2006Jul 19, 2006 · Referred to the House Committee on House Administration.
- H.Res. 788 Supporting the goals and ideals of Peace Officers Memorial Day.May 16, 2006 · Motion to reconsider laid on the table Agreed to without objection.
- H.R. 4988 House Ethics Reform Act of 2006Apr 27, 2006 · Sponsor introductory remarks on measure. (CR H1880)
Top bills sponsored
- H.R. 834 (106th) National Historic Preservation Act Amendments of 2000Became law
- H.R. 581 (107th) To authorize the Secretary of the Interior and the Secretary of Agriculture to use funds appropriated for wildland fire management in the Department of the…Became law
- H.R. 1026 (104th) To designate the United States Post Office building located at 201 East Pikes Peak Avenue in Colorado Springs, Colorado, as the "Winfield Scott Stratton Post…Became law
- H.R. 2187 (107th) To amend title 10, United States Code, to make receipts collected from mineral leasing activities on certain naval oil shale reserves available to cover…Became law
- H.R. 154 (106th) An Act to allow the Secretary of the Interior and the Secretary of Agriculture to establish a fee system for commercial filming activities on Federal land…Became law
- H.J.Res. 576 (100th) A joint resolution designating February 19 through 25, 1989, as "National Visiting Nurse Associations Week".Became law
- H.Con.Res. 87 (100th) A concurrent resolution to recognize the International Association of Fire Fighters and the National Fallen Fire Fighter Memorial in Colorado Springs, Colorado.Passed a chamber
- H.Res. 622 (108th) Supporting the goals and ideals of Peace Officers Memorial Day.Passed a chamber
Laws first, then bills that passed a chamber, were reported from committee, or drew the most cosponsors.
Elections Rep. Hefley has won
Rep. Hefley has won 10 U.S. House elections (1986–2004). Of the contested races, margins ran from 36.4 to 70.4 points.
Full election history for this seat →
Source: MIT Election Data and Science Lab, U.S. House V15 / U.S. Senate V8 (CC0), retrieved 2026-10-18; winners matched to member records by seat and term. Results run through the 2024 elections; nothing from 2026 is shown until it is certified. A margin is a fact about one election, never a score of how well a member represents anyone, and PORKER does not rank members by it.
How has Colorado’s 5th district done while Rep. Hefley served?
2005 to 2006 in CO-5: typical household income was about the same after inflation, the share of people below the poverty line was about the same, and the share of workers looking for a job was about the same.
Each mini chart has its own scale, fitted to its lines (it does not start at zero), so compare the numbers, not the heights. Teal = district, oxblood = state, grey = U.S.
While they served, not because of them. This shows what happened in Colorado’s 5th district during Hefley’s time representing it (1987 to 2007). It does not say what the member did or caused. It is not a score, and PORKER never ranks members on it.
One set of district lines. CO-5 was redrawn in 2012 and again in 2022 (the survey year the new lines first appear), but every survey year in Hefley’s term so far (2005 and 2006) uses the same lines, so they can be compared. The Census Bureau has no 2020 yearly estimate.
Official records on bills this member sponsored
109th Congress. What Congress.gov lists for the 20 bills sponsored.
| Record | Bills | Source |
|---|---|---|
| Bills sponsored | 20 | Source: Congress.gov member record, PORKER copy of October 26, 2026 ↗ See them → |
| With a sponsor’s constitutional-authority statement | 0 | None listed |
| With a CBO cost estimate listed | 0 | None listed |
| With a committee report listed | 0 | None listed |
Evidence
- How counted
- Bills where this member is the lead (first-listed) sponsor in the 109th Congress, read from the stored Congress.gov bill records
- Fields
- cboCostEstimates, committeeReports, constitutionalAuthorityStatementText, notes
- PORKER copy refreshed
- October 26, 2026 (nightly)
Read this first. These are counts of records Congress.gov lists. Many bills never get a CBO estimate or a report, so a zero is not a mark against a member. We never show this as a score.
Data as of Oct 26, 2026 · Sources: Congress.gov, Senate.gov, House Clerk, Appropriations Committee earmark tables. PORKER is non-partisan.