Former member of Congress · last served 110th Congress
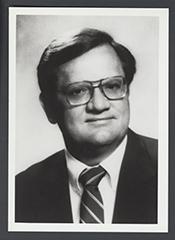
Paul E. Gillmor
Paul Gillmor was a Republican U.S. representative from Ohio, first elected to Congress in 1989, who sponsored 4 bills that became law (101st–110th Congress).
How we count: “Broke with party” is a yes/no roll call where the member voted against most of their own party on that vote (party as recorded; even splits not counted). “Pork: own share” splits each earmark shared by several members evenly among them.
Recent votes
No recorded roll-call votes in PORKER’s records. Roll-call records start in 2011.
5 most recent bills
- H.Res. 440 Expressing the sense of the House of Representatives that any comprehensive plan to combat illegal immigration must increase resources for border patrol…May 24, 2007 · Referred to the House Committee on the Judiciary.
- H.R. 698 Industrial Bank Holding Company Act of 2007May 22, 2007 · Received in the Senate and Read twice and referred to the Committee on Banking, Housing, and Urban Affairs.
- H.R. 381 Gifted and Talented Education Enhancement Act of 2007May 9, 2007 · Referred to the Subcommittee on Higher Education, Lifelong Learning, and Competitiveness.
- H.R. 1341 Honest Income Disclosure ActApr 13, 2007 · Referred to the Subcommittee on Capital Markets, Insurance and Government Sponsored Enterprises.
- H.R. 1208 Corporate Charitable Disclosure Act of 2007Apr 11, 2007 · Referred to the Subcommittee on Capital Markets, Insurance and Government Sponsored Enterprises.
Top bills sponsored
- H.R. 985 (108th) To designate the facility of the United States Postal Service located at 111 West Washington Street in Bowling Green, Ohio, as the "Delbert L. Latta Post…Became law
- H.R. 678 (105th) Thomas Alva Edison Commemorative Coin ActBecame law
- H.R. 2869 (107th) Small Business Liability Relief and Brownfields Revitalization ActBecame law
- H.R. 4637 (109th) To make certain technical corrections in amendments made by the Energy Policy Act of 2005.Became law
- H.R. 1831 (107th) Small Business Liability Protection ActPassed a chamber
- H.R. 2491 (109th) International Solid Waste Importation and Management Act of 2006Passed a chamber
- H.R. 1089 (106th) Mutual Fund Tax Awareness Act of 2000Passed a chamber
- H.R. 5439 (107th) To designate the facility of the United States Postal Service located at 111 West Washington Street in Bowling Green, Ohio, as the "Delbert L. Latta Post…Passed a chamber
Laws first, then bills that passed a chamber, were reported from committee, or drew the most cosponsors.
Elections Rep. Gillmor has won
Rep. Gillmor has won 10 U.S. House elections (1988–2006). Of the contested races, margins ran from 13.7 to 46.7 points.
Full election history for this seat →
Source: MIT Election Data and Science Lab, U.S. House V15 / U.S. Senate V8 (CC0), retrieved 2026-10-18; winners matched to member records by seat and term. Results run through the 2024 elections; nothing from 2026 is shown until it is certified. A margin is a fact about one election, never a score of how well a member represents anyone, and PORKER does not rank members by it.
How has Ohio’s 5th district done while Rep. Gillmor served?
2005 to 2006 in OH-5: typical household income was about the same after inflation, the share of people below the poverty line was about the same, and the share of workers looking for a job was about the same.
Each mini chart has its own scale, fitted to its lines (it does not start at zero), so compare the numbers, not the heights. Teal = district, oxblood = state, grey = U.S.
While they served, not because of them. This shows what happened in Ohio’s 5th district during Gillmor’s time representing it (1989 to 2007). It does not say what the member did or caused. It is not a score, and PORKER never ranks members on it.
One set of district lines. OH-5 was redrawn in 2012 and again in 2022 (the survey year the new lines first appear), but every survey year in Gillmor’s term so far (2005 and 2006) uses the same lines, so they can be compared. The Census Bureau has no 2020 yearly estimate.
Official records on bills this member sponsored
110th Congress. What Congress.gov lists for the 11 bills sponsored.
| Record | Bills | Source |
|---|---|---|
| Bills sponsored | 11 | Source: Congress.gov member record, PORKER copy of October 26, 2026 ↗ See them → |
| With a sponsor’s constitutional-authority statement | 0 | None listed |
| With a CBO cost estimate listed | 1 | See the 1 → |
| With a committee report listed | 1 | See the 1 → |
Evidence
- How counted
- Bills where this member is the lead (first-listed) sponsor in the 110th Congress, read from the stored Congress.gov bill records
- Fields
- cboCostEstimates, committeeReports, constitutionalAuthorityStatementText, notes
- PORKER copy refreshed
- October 26, 2026 (nightly)
Read this first. These are counts of records Congress.gov lists. Many bills never get a CBO estimate or a report, so a zero is not a mark against a member. We never show this as a score.
Data as of Oct 26, 2026 · Sources: Congress.gov, Senate.gov, House Clerk, Appropriations Committee earmark tables. PORKER is non-partisan.