Member of Congress · 119th Congress
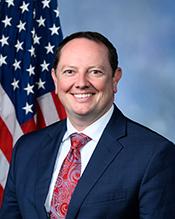
Eric Burlison
Eric Burlison is a Republican U.S. representative from Missouri, in Congress since 2023, who voted with most Republicans on 84% of the 119th Congress’s yes/no votes.
How we count: “Broke with party” is a yes/no roll call where the member voted against most of their own party on that vote (party as recorded; even splits not counted). “Pork: own share” splits each earmark shared by several members evenly among them.
5 most recent votes
- YeaOn Motion to Suspend the Rules and Pass — Retire through Ownership ActSep 16, 2026 · Passed
- YeaOn Motion to Suspend the Rules and Pass, as Amended — Water Resources Development Act of 2026Sep 16, 2026 · Passed
- YeaOn Motion to Suspend the Rules and Pass, as Amended — Ratepayer Protection ActSep 16, 2026 · Passed
- YeaOn Passage — Providing for congressional disapproval under chapter 8 of title 5, United States Code, of the rule issued by the Environmental Protection…Sep 16, 2026 · Passed
- YeaOn Passage — PROOF ActSep 16, 2026 · Passed
5 most recent bills
- H.R. 10015 Great American Healthcare ActAug 3, 2026 · Referred to the Committee on Energy and Commerce, and in addition to the Committees on Ways and Means, Education and Workforce, the Judiciary, Armed Services…
- H.R. 4123 FIT Procurement ActJul 21, 2026 · Received in the Senate and Read twice and referred to the Committee on Homeland Security and Governmental Affairs.
- H.Res. 1412 Expressing support for July, the month of America's birthday, to become "National Fireworks Month".Jul 2, 2026 · Referred to the House Committee on Energy and Commerce.
- H.R. 9264 No Exceptions for Non-Citizens Voting ActJun 11, 2026 · Referred to the House Committee on the Judiciary.
- H.R. 8677 Make the American Dream Real Again ActMay 7, 2026 · Referred to the House Committee on Ways and Means.
Top bills sponsored
- H.R. 7388 (119th) Smart Space Act of 2026Passed a chamber
- H.R. 9595 (118th) FIT Procurement ActPassed a chamber
- H.R. 2409 (119th) Guidance Clarity Act of 2025Reported from committee
- H.R. 2174 (119th) Paycheck Protection ActReported from committee
- H.R. 722 (119th) Life at Conception Act116 cosponsors
- H.Res. 1305 (118th) Rescinding the subpoenas issued by the January 6th Select Committee on September 23, 2021, October 6, 2021, and February 9, 2022, and withdrawing the…43 cosponsors
- H.R. 221 (119th) Abolish the ATF Act34 cosponsors
- H.R. 335 (119th) Repeal the NFA Act25 cosponsors
Laws first, then bills that passed a chamber, were reported from committee, or drew the most cosponsors.
Committees
- House Committee on Oversight and Government ReformCybersecurity, Information Technology, and Government Innovation, Delivering on Government Efficiency, Economic Growth, Energy Policy, and Regulatory Affairs
- House Committee on Transportation and InfrastructureHighways and Transit, Railroads, Pipelines, and Hazardous Materials, Water Resources and Environment
Elections Rep. Burlison has won
Rep. Burlison has won 2 U.S. House elections (2022–2024). Of the contested races, margins ran from 44.1 to 45.3 points.
Full election history for this seat →
Source: MIT Election Data and Science Lab, U.S. House V15 / U.S. Senate V8 (CC0), retrieved 2026-10-18; winners matched to member records by seat and term. Results run through the 2024 elections; nothing from 2026 is shown until it is certified. A margin is a fact about one election, never a score of how well a member represents anyone, and PORKER does not rank members by it.
How has Missouri’s 7th district done while Rep. Burlison served?
2023 to 2024 in MO-7: typical household income was up 6% after inflation, the share of people below the poverty line was down 1.8 points, and the share of workers looking for a job was about the same.
Each mini chart has its own scale, fitted to its lines (it does not start at zero), so compare the numbers, not the heights. Teal = district, oxblood = state, grey = U.S.
While they served, not because of them. This shows what happened in Missouri’s 7th district during Burlison’s time representing it (2023 to now). It does not say what the member did or caused. It is not a score, and PORKER never ranks members on it.
One set of district lines. MO-7 was redrawn in 2012 and again in 2022 (the survey year the new lines first appear), but every survey year in Burlison’s term so far (2023 and 2024) uses the same lines, so they can be compared. The Census Bureau has no 2020 yearly estimate.
Local offices
Offices in the district or state, as listed in a public-domain community file. The Washington office is in the Contact section above.
- Joplin office2727 E. 32nd Street, Suite 2, Joplin, MO 64804
Phone 417-781-1041 · Fax 771-200-5750 · Map ↗ (OpenStreetMap) - Springfield office3232 E. Ridgeview St., Springfield, MO 65804
Phone 417-889-1800 · Fax 771-200-5750 · Map ↗ (OpenStreetMap)
Evidence
- File
- legislators-district-offices-2026-09-24-8d698e92.json, entries B001316-joplin, B001316-springfield (2 offices)
- Published at
- https://unitedstates.github.io/congress-legislators/legislators-district-offices.json
- File date
- September 24, 2026 (server “last modified”)
- Retrieved by PORKER
- October 16, 2026
- File SHA-256
8d698e92f8ebae3bdd387bfef239584164160e59d444ba1cbff46f32aa450f59- Licence
- CC0 1.0 (public domain)
Read this first. This list is kept up by volunteers and may be out of date. Confirm hours and addresses on the member’s official site, burlison.house.gov.
Official records on bills this member sponsored
119th Congress. What Congress.gov lists for the 26 bills sponsored.
| Record | Bills | Source |
|---|---|---|
| Bills sponsored | 26 | Source: Congress.gov member record, PORKER copy of October 25, 2026 ↗ See them → |
| With a sponsor’s constitutional-authority statement | 24 | See the 24 → |
| With a CBO cost estimate listed | 4 | See the 4 → |
| With a committee report listed | 2 | See the 2 → |
Evidence
- How counted
- Bills where this member is the lead (first-listed) sponsor in the 119th Congress, read from the stored Congress.gov bill records
- Fields
- cboCostEstimates, committeeReports, constitutionalAuthorityStatementText, notes
- PORKER copy refreshed
- October 25, 2026 (nightly)
Read this first. These are counts of records Congress.gov lists. Many bills never get a CBO estimate or a report, so a zero is not a mark against a member. We never show this as a score.
Data as of Oct 26, 2026 (member stats) · latest recorded House vote Sep 16, 2026 · Sources: Congress.gov, Senate.gov, House Clerk, Appropriations Committee earmark tables. PORKER is non-partisan.